Metrics are incredibly important to collect and understand. Not only will they be there to support you when “shit hits the fan” but also when you want to improve the resiliency of your service. They also play an important role in capacity planning, trending, continuous intergration/continuous deployment and performance tuning. Etsy talks more about the importance of collecting metrics here, measure anything, measure everything.
In this post we are going to examine how to collect metrics for two popular web servers, Nginx and Apache.
Let’s get started…
Nginx
Installation
The ‘HttpStubStatusModule’ is not compiled into Nginx by default. To check if it is, run
[root@ip- ~]# /usr/sbin/nginx -V
nginx version: nginx/1.2.5
configure arguments:  **--with-http_stub_status_module**
Here we can see the version of Nginx I’m using in AWS from the ‘amzn-updates’ repository comes with it compiled in. If you didn’t see the output above and are compiling from source, ensure the following argument is set --with-http_stub_status_module
More information about the module can be found here.
Configuration
The configuration is simple for the Nginx status module. Add the code below to a server block, replacing “YOUR_IP” with the IP address of your computer. This will only allow connections via localhost and your computer to the status page. Then reload nginx /etc/init.d/nginx reload
server {
    server_name www.drewl.org;
    ...

    location /nginx_status {
        stub_status on;
        access_log off;
        allow 127.0.0.1;
        allow YOUR_IP;
        deny all;
    }
}
Results
Either with curl or a web browser go to ‘http://YOUR_SITE.com/nginx_status'
curl http://YOUR_SITE.com/nginx_status

Active connections: 59
server accepts handled requests
 11939 11939 17784
Reading: 0 Writing: 1 Waiting: 58
The output can be interpreted as…
- active (59)
- currently established connections
- accepts (11939)
- running count of accepted requests
- handled (11939)
- running count of handled requests
- should be the same as accepts unless resource limits were reached
- requests (17784)
- running count of established requests
- will be a different value than “accepts” if keepalive is enabled
- requests per connection = requests / handled
- 17784/11939 = 1.5 requests per connection
- requests per connection = requests / handled
- reading (0)
- reading the request headers
- expected to be near 0 especially if request headers can fit into one packet
- might not be 0 when large cookies are being sent
- writing (1)
- reading the request body, processing requests, or writing a client response
- waiting (58)
- number of keep alive connections opened
- active - (reading + writing)
Apache
Installation
The mod_status module is usually shipped by default when you install Apache via the package provider of your OS’s distribution but lets check…
[root@graphite ~]# httpd -V
Server version: Apache/2.2.15 (Unix)
Server built:   Aug 13 2013 17:29:28

[root@graphite ~]# httpd -M | grep status
[Wed Dec 18 00:01:27 2013] [warn] module wsgi_module is already loaded, skipping
 status_module (shared)
If mod_status is not available, when you compile it from source ensure the --enable-status argument is present.
Assuming the module is available let’s get started. Before copying and pasting this, review your httpd.conf, as it might already have these options enabled. If not, let’s add the Location directive below.
Replace “YOUR_IP” with the IP address of your computer. Once completed restart apache but before restarting it’s always a good idea to test the config (/etc/init.d/httpd configtest). This Location directive can be moved to a Virtualhost instead of the global httpd.conf if desired for security reasons.
vi /etc/httpd/conf/httpd.conf

<IfModule !status_module>
    LoadModule status_module modules/mod_status.so
</IfModule>

<Location /server-status>
    SetHandler server-status
    Order deny,allow
    Deny from all
    Allow from 127.0.0.1
    Allow from YOUR_IP
</Location>
Results
With a web browser go to “http://YOUR_SITE.com/server-status?refresh=5". This will refresh the status page every 5 seconds.
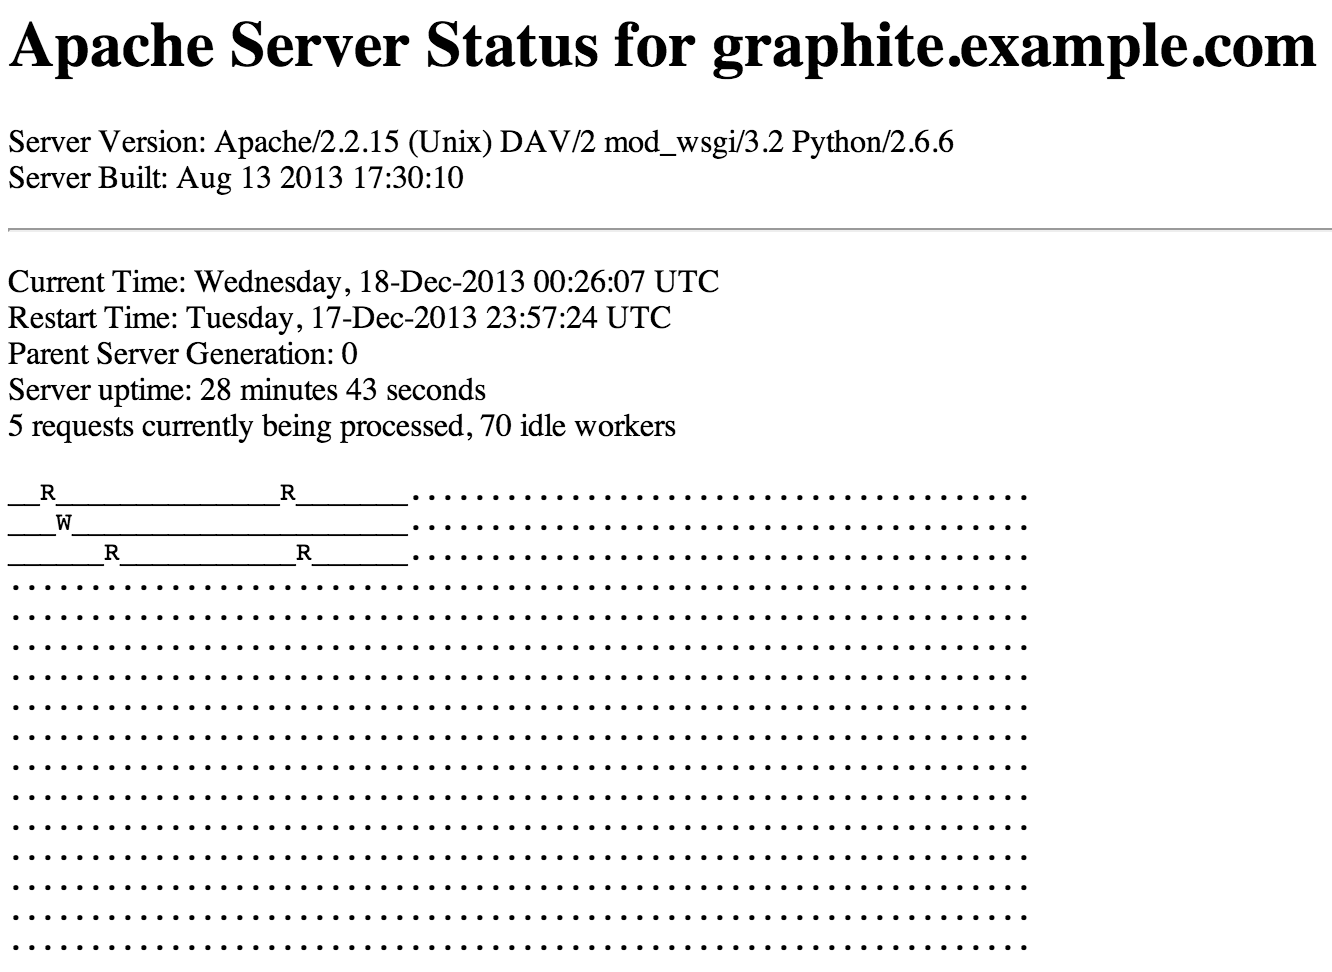
This shows…
- Number of workers serving requests
- Number of idle workers
- Server uptime
- The scoreboard! more on this below…
With curl add ‘?auto’ to the end of the URI and this will produce a machine friendly view of the information we saw before.
curl http://YOUR_SITE/server-status?auto

BusyWorkers: 1
IdleWorkers: 74
Scoreboard: W________________________..RRR....
ExtendedStatus
The ExtendedStatus directive shows even more information in regards to the requests being processed. But be cautious, according to the docs the web server can slow down, how much I don’t know yet.
In additional to what we saw above we also get…
- Total Accesses: Total number of requests
- Total kBytes: Total number of KB’s served
- CPULoad: CPU Usage of Apache
- ReqPerSec: Number of requests per second
- BytesPerSec: Number of bytes per second
- BytesPerReq: Average number of bytes per request
Automatically with a curl
curl http://YOUR_SITE/server-status?auto

Total Accesses: 28
Total kBytes: 23
CPULoad: .166667
Uptime: 18
ReqPerSec: 1.55556
BytesPerSec: 1308.44
BytesPerReq: 841.143
BusyWorkers: 2
IdleWorkers: 73
Scoreboard: W________________________..RRR....
Manually via a web browser
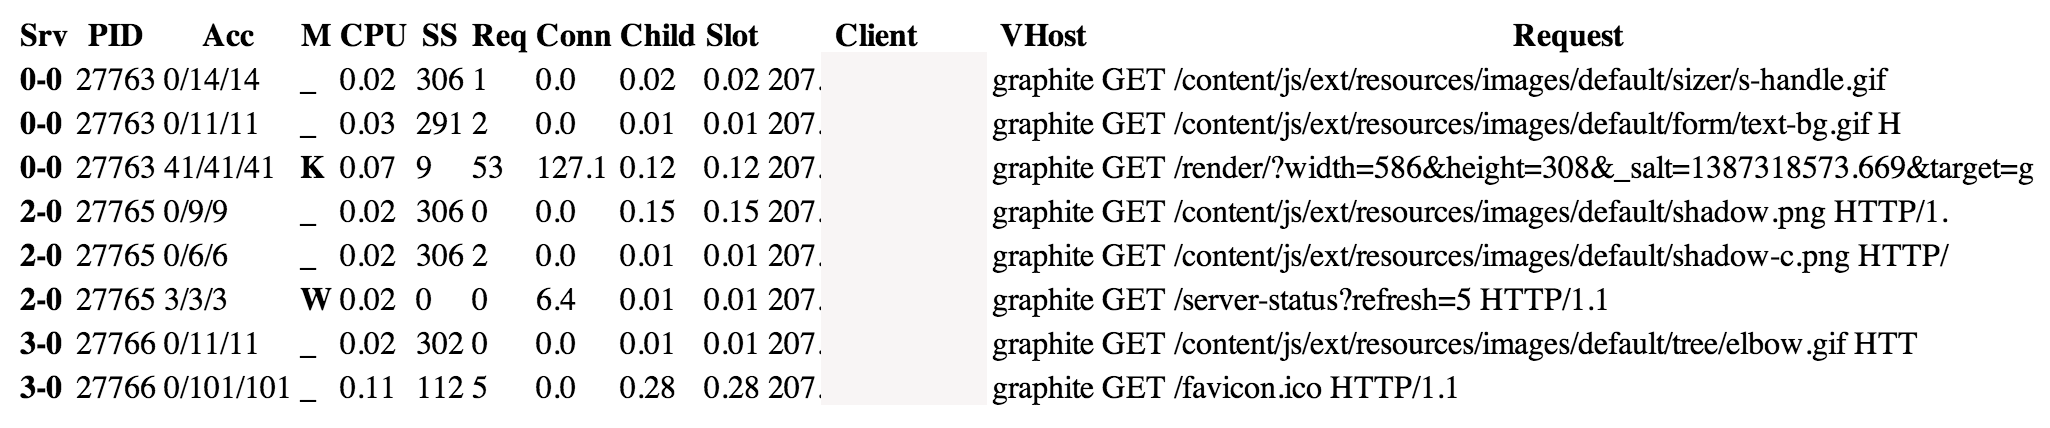
This can be helpful if you need to trace down user requests that are causing Apache to use a lot of CPU resources.
Srv    Child Server number - generation
PID    OS process ID
Acc    Number of accesses this connection / this child / this slot
M      Mode of operation
CPU    CPU usage, number of seconds
SS     Seconds since beginning of most recent request
Req    Milliseconds required to process most recent request
Conn   Kilobytes transferred this connection
Child  Megabytes transferred this child
Slot   Total megabytes transferred this slot
Scoreboard
The scoreboard shown above is what’s used by programs such as Monit to gather metrics to determine the health of Apache.
The scoreboard can be decoded as…
- ‘_’ Waiting for a connection
- ‘S’ Starting up
- ‘R’ Reading request
- ‘W’ Sending reply
- ‘K’ Keepalive (read)
- ‘D’ DNS lookup,
- ‘C’ Closing connection
- ‘L’ Logging
- ‘G’ Gracefully finishing
- ‘I’ Idle cleanup of worker
- ‘.’ Open slot with no current process
Things to look for
- A high numer of ‘K’ keys could mean you have your KeepAliveTimeout set to high
- A high number ‘L’ keys could be a sign of IO bottlenecks
- A low number of ‘.’ keys could be a sign you need to increase ServerLimit or MaxClients
- A low number of ‘idle workers’ could be a sign you need to increase MinSpareThreads
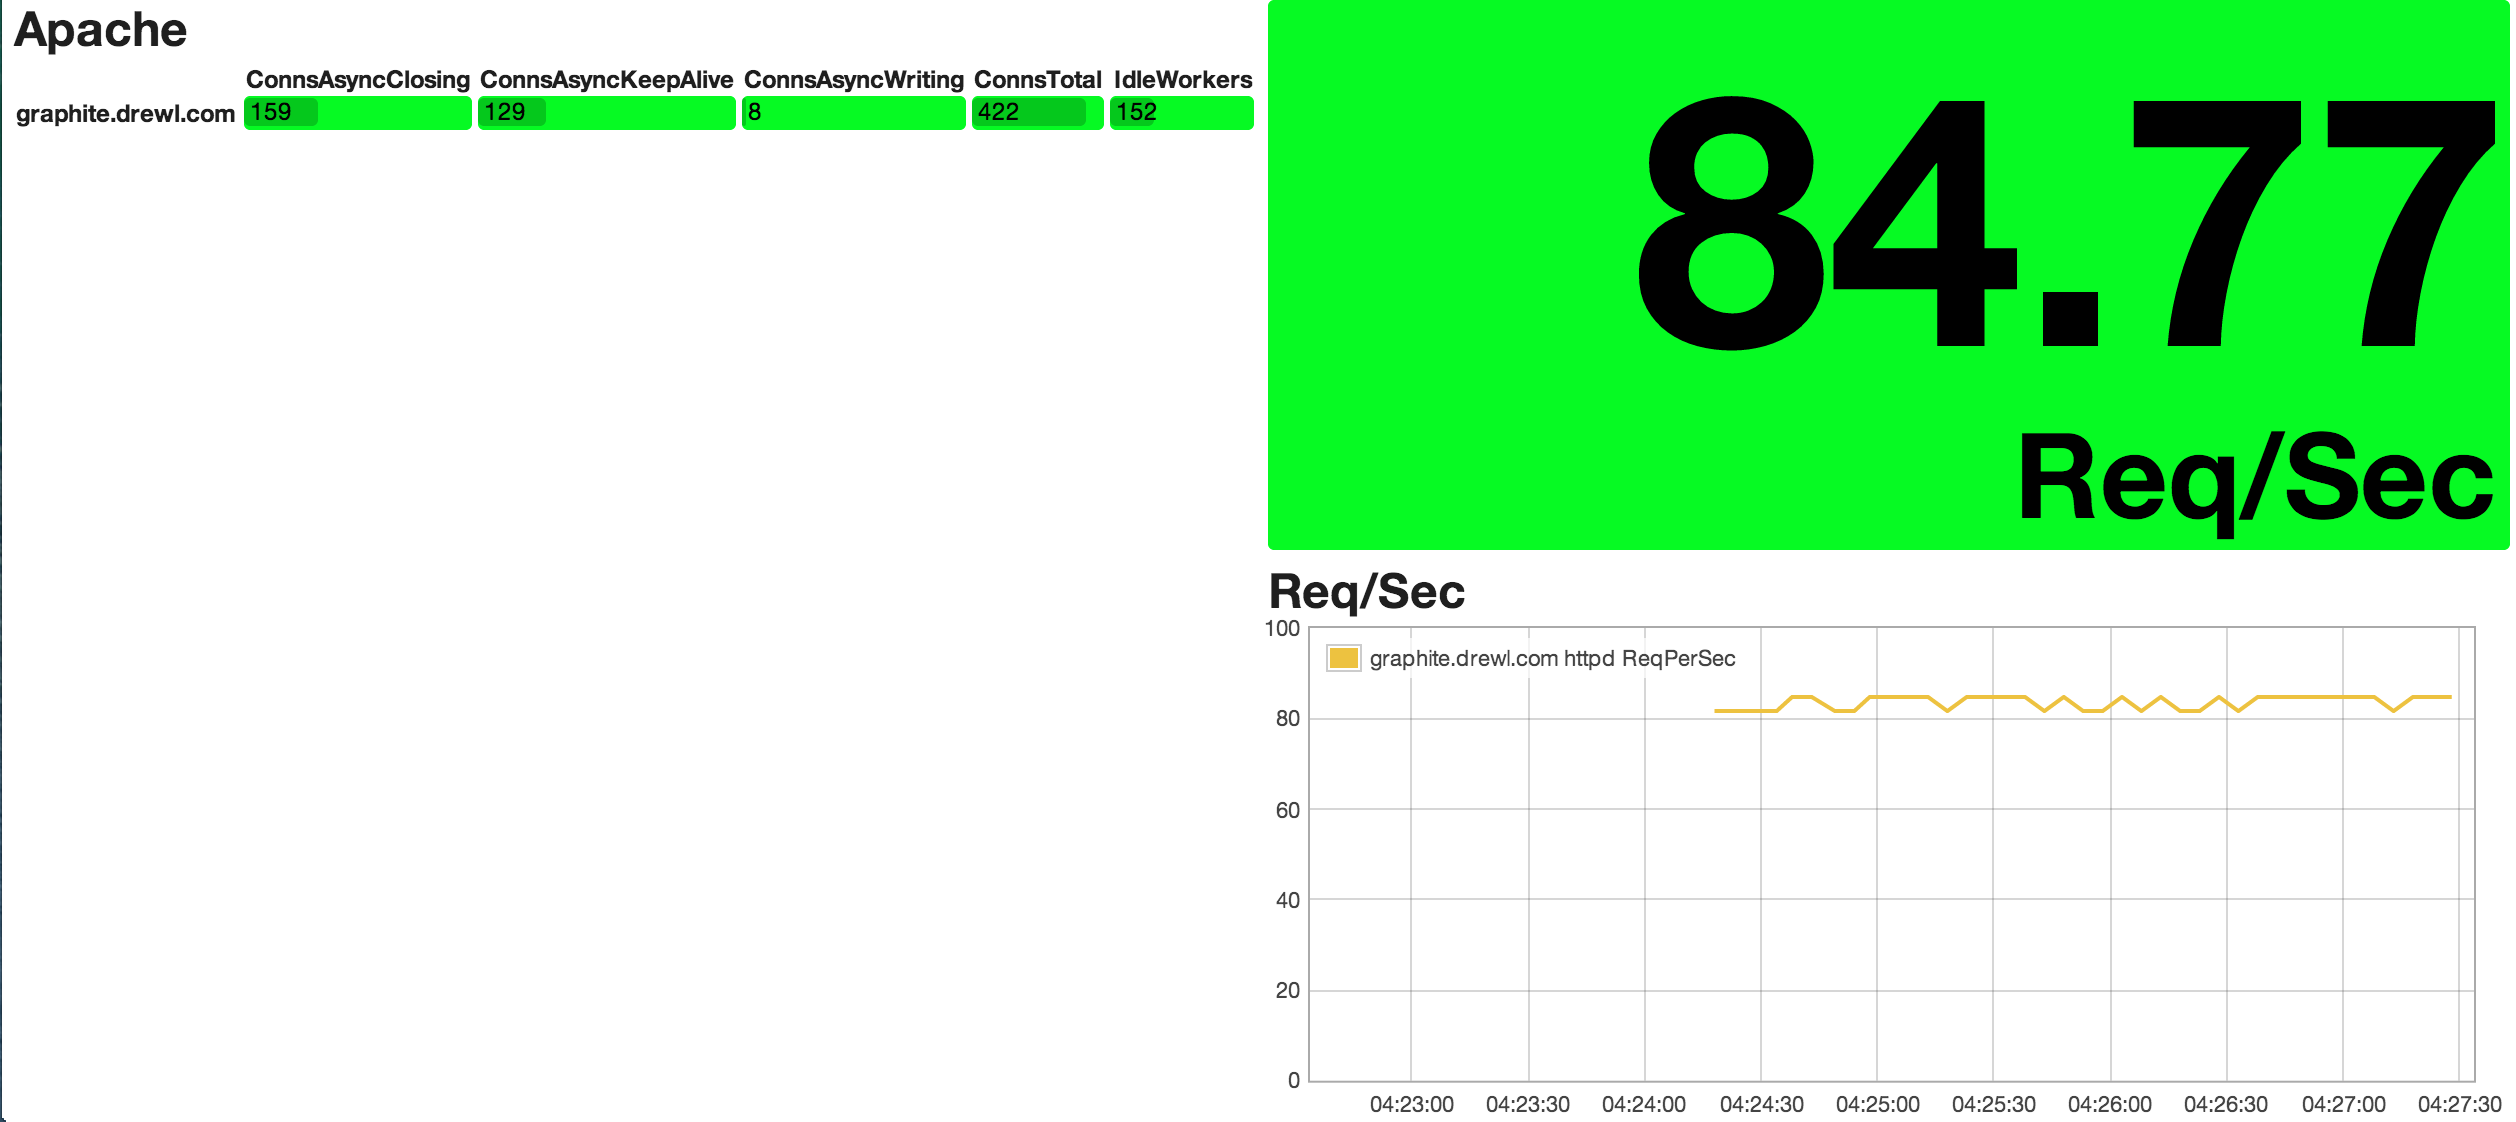
Collecting
Now that we have both web servers configured to query for metrics its time to start collecting.
There are a couple of tools to use at our disposable.
I’m going to be using a tool called Riemann for collecting the metrics. I’ll leave the setup, configuration and Graphite integration for another post as this one is already lengthy.
Assuming you have Riemann setup along with Riemann Tools we are ready to start collecting the metrics.
Nginx
Let’s start collecting the Nginx metrics
riemann-nginx-status --host 162.243.251.204 -u http://127.0.0.1/nginx_status --event-host drewl.org
Apache
and the Apache metrics
riemann-apache-status --host 162.243.251.204 -u http://127.0.0.1/server-status --event-host graphite.org
and that’s all folk’s, hopefully this will prove useful to help you start collecting and measuring all the things!
More Areas to Explore
- Collect the total number of responses with status codes 1XX, 2XX, 3XX, 4XXX and 5XXX
- SSL Metrics